Transforming Data into Stories: The Power of Modern Gradient Infographic Presentations
In the contemporary landscape of business communication and education, the definition of a compelling presentation has evolved significantly. For decades, presenters relied heavily on bullet points, dense paragraphs, and static photographs to convey information. However, as audiences become more visually literate and attention spans grow shorter, this traditional approach often fails to engage or persuade. A truly effective presentation is no longer just about text, images, or videos in isolation. When you are tasked with presenting a complex report, the ability to visualize data through charts and graphics becomes paramount. This shift has given rise to the modern gradient infographic presentation, a design philosophy that marries aesthetic appeal with functional clarity.
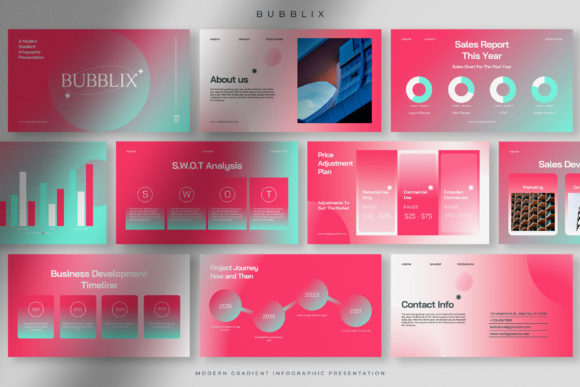
To navigate this visual evolution successfully, professionals need tools that bridge the gap between raw data and human understanding. This is where specialized templates like Bubblix, a cotton candy modern gradient infographic presentation template, play a critical role. Designed specifically for weekly reports, monthly summaries, annual reviews, and project updates, Bubblix exemplifies how soft aesthetics can deliver hard-hitting insights. By utilizing a unique combination of pink, white, and blue gradients, it offers a "cotton candy" aesthetic that is surprisingly effective in professional settings. This article explores why this specific style of presentation matters, how it enhances data comprehension, and how you can leverage such templates to make your reports lively, outstanding, and eye-catching.
Beyond Text and Video: The Necessity of Visual Data
A common misconception in corporate and academic environments is that adding an image or embedding a video automatically makes a presentation engaging. While multimedia elements are valuable, they do not always serve the primary goal of a report: conveying structured information. If you are presenting quarterly sales figures, team performance metrics, or budget allocations, a stock photo of people shaking hands adds emotional tone but zero informational value. Similarly, a video might explain a concept broadly but cannot display specific comparative data at a glance.
This is where infographic presentations distinguish themselves. They transform abstract numbers into tangible shapes, flows, and hierarchies. The human brain processes visual information 60,000 times faster than text, making infographics the most efficient vehicle for data transmission. When you utilize a template designed for reporting, you are not merely decorating slides; you are engineering cognitive ease for your audience. You are reducing the mental load required to understand trends, outliers, and relationships within your data. In high-stakes environments where supervisors or teammates need to grasp complex situations quickly, the chart-heavy nature of infographic templates is not a stylistic choice—it is a strategic necessity.
The Psychology of Soft Gradients in Professional Design
One might assume that serious business reports require stark, high-contrast, or monochromatic color schemes. However, modern design psychology suggests otherwise. The use of gradients, particularly the soft pink, white, and blue palette found in the Bubblix template, serves a distinct psychological purpose. Harsh colors and rigid lines can sometimes induce stress or cognitive fatigue, especially when an audience is reviewing dense analytical content. Conversely, the "cotton candy" gradient effect creates a sense of calm and approachability.
This softness does not diminish professionalism; rather, it enhances receptivity. When data is presented against a soothing, modern gradient background, the viewer feels less overwhelmed by the complexity of the information. The transition between colors guides the eye across the slide naturally, creating a visual flow that mimics the narrative arc of your spoken presentation. Furthermore, these pastel tones align with current digital design trends, signaling to your audience that your organization is modern, forward-thinking, and attentive to user experience. It transforms a potentially dry monthly report into a visually pleasing experience that maintains engagement without sacrificing authority.
Structuring Success: Organization Meets Creativity
Aesthetics alone cannot save a disorganized presentation. The true power of a modern infographic template lies in its structural integrity. Templates like Bubblix are engineered with well-organized layouts that enforce discipline in storytelling. When creating reports from scratch, presenters often struggle with alignment, spacing, and hierarchy, leading to cluttered slides that confuse rather than clarify. A pre-designed layout solves this by providing a framework where every element has a designated purpose.
Consider the practical application of this organization:
- Hierarchical Clarity: Pre-set layouts ensure that headlines, key metrics, and supporting details are visually distinct, allowing the audience to scan for the most important information first.
- Consistency Across Slides: Using a unified template ensures that fonts, colors, and graphic styles remain consistent throughout a 10-slide deck or a 50-slide annual review, reinforcing brand identity and cognitive familiarity.
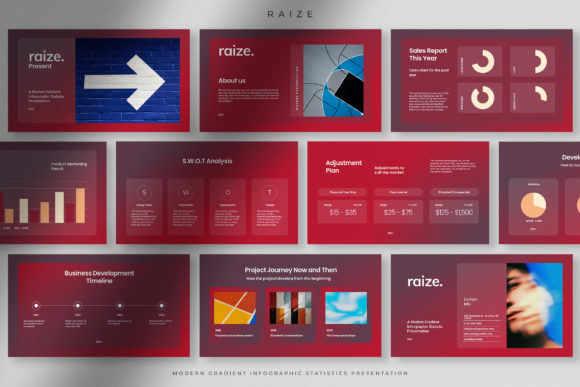
- Data Visualization Variety: Specialized templates include diverse chart types—timelines, SWOT analyses, funnel charts, and circular diagrams—that are already styled to match the theme, eliminating the mismatched look of default software charts.
This level of organization helps you provide better explanations to teammates and supervisors because the structure itself acts as a guide. It forces the presenter to distill their thoughts into clear categories, ensuring that the final output is neat, logical, and easy to follow.
Versatility Across Different Reporting Needs
The beauty of a modern gradient infographic template is its adaptability. While Bubblix features a specific cotton candy aesthetic, its underlying structure supports a wide variety of reporting contexts. Understanding how to apply this versatility is key to maximizing its value.
- Weekly and Monthly Reports: These frequent updates often suffer from "template fatigue," where audiences stop paying attention because every update looks identical. Introducing a fresh, colorful gradient design re-engages stakeholders and signals that care has been put into the communication.
- Annual Reports: Year-end summaries are typically data-heavy. The ample space for graphics in infographic templates allows you to break down twelve months of performance into digestible visual milestones rather than endless tables.
- Project Proposals and Business Plans: When pitching a new initiative, you must balance creativity with feasibility. The modern gradient style suggests innovation, while the structured charts demonstrate rigorous planning and organization.
- Educational and Training Materials: For educators or corporate trainers, the soft color palette reduces anxiety around learning complex topics, making the material feel more accessible to students or new hires.
Practical Implementation: Customizing Your Template
Adopting a template like Bubblix does not mean sacrificing your unique voice or specific data needs. On the contrary, these templates are built as flexible foundations. Consisting of 10 unique slide designs and available in both PPT and PPTX formats, they offer broad compatibility across devices and software versions. The editing process is designed to be intuitive, whether you are a seasoned designer or a beginner using Microsoft PowerPoint.
You have full control over the customization process. While the default pink, white, and blue scheme provides that signature cotton candy taste, every color is editable to match your specific brand guidelines. Perhaps your company uses deep navy and gold; you can adjust the gradient stops to reflect this while retaining the modern, smooth transition effect. Similarly, text placeholders are fully responsive, allowing you to expand or condense content without breaking the layout. Images can be swapped out instantly, and charts can be linked directly to Excel spreadsheets for real-time data updates.
Furthermore, comprehensive help documentation is typically included with premium templates like Bubblix. This resource is invaluable for users who may be unfamiliar with advanced PowerPoint features such as master slides, vector editing, or gradient manipulation. It ensures that the barrier to entry remains low, allowing anyone to produce professional-grade visualizations without hiring a graphic designer. By leveraging these editable assets, you ensure that your presentation is not only visually stunning but also accurately reflective of your specific message and data.
Elevating Communication Through Design
Ultimately, the goal of using a modern gradient infographic presentation template is to elevate the quality of communication. In a world saturated with information, clarity is kindness. When you take the time to present your weekly, monthly, or annual reports using a tool like Bubblix, you are demonstrating respect for your audience's time and intelligence. You are acknowledging that they deserve information that is easy to consume, pleasant to view, and simple to understand.
Making your report more lively, outstanding, and eye-catching is not about vanity; it is about efficacy. A beautiful presentation captures attention, aids memory retention, and facilitates decision-making. As we move further into a visual-first era of business and education, mastering the art of the infographic presentation is no longer optional. It is a fundamental skill for anyone who wishes to inform, persuade, and inspire. By combining the soft allure of modern gradients with the rigorous structure of data visualization, you create a powerful synergy that turns ordinary reports into extraordinary narratives.