Infographic Template with 3D Shape: Visual Guide
In a digital landscape saturated with flat design and minimalist aesthetics, capturing audience attention requires more than just good data. It demands visual depth. An Infographic Template with 3D Shape offers a practical solution for creators who need to transform abstract concepts into tangible, engaging visuals. Rather than relying on complex rendering software or hiring expensive 3D artists, these templates provide pre-designed vector elements that simulate three-dimensional space. They bridge the gap between professional graphic design and accessible content creation, allowing marketers, educators, and business owners to present information with added weight and perspective.
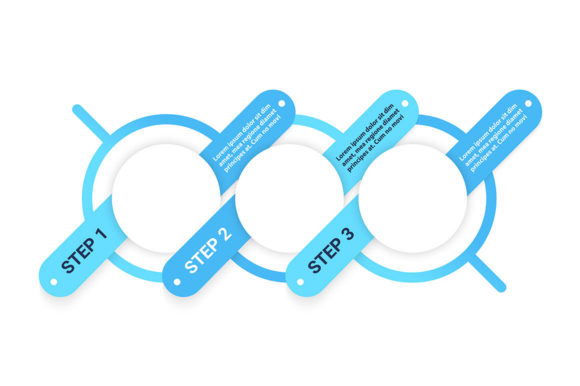
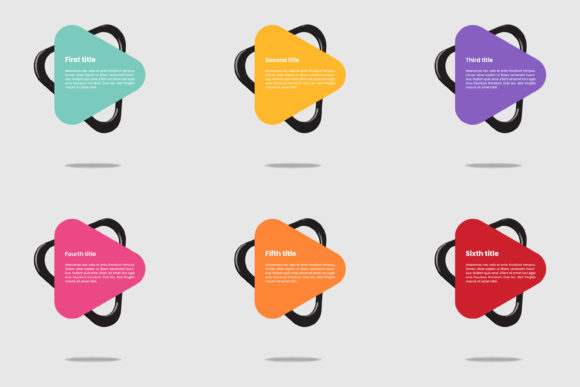
At its core, this type of template is a collection of graphical assets designed to mimic physical objects. These might include floating cubes, spherical nodes, cylindrical steps, or isometric platforms. While the underlying file is often a standard 2D vector format compatible with tools like Adobe Illustrator, PowerPoint, or Canva, the shading, lighting, and perspective are baked in to create the illusion of volume. This makes them incredibly versatile for illustrating processes, hierarchies, and workflows where flat icons might feel too static or disconnected.
Why Depth Matters in Data Visualization
The primary appeal of incorporating 3D shapes into your layout lies in cognitive engagement. Human brains are wired to interpret depth cues as indicators of importance and reality. When you use a flow chart composed of flat boxes, the viewer processes it as a schematic. When those same boxes have dimension, shadow, and texture, the viewer perceives them as distinct objects occupying a shared space. This subtle psychological shift can make a process diagram feel more like a journey and less like a checklist.
For professionals presenting to stakeholders or clients, this distinction is valuable. A corporate presentation regarding quarterly profit or growth metrics benefits from visuals that feel substantial. Three-dimensional columns in a bar chart or stacked layers in a pyramid diagram convey stability and structure. They suggest that the data has been built upon a solid foundation rather than simply placed on a page. This aesthetic choice signals effort and polish, which indirectly boosts the perceived credibility of the information being presented.
Practical Applications Across Industries
The versatility of an Infographic template with 3d shape extends far beyond simple decoration. These assets solve specific communication problems across various sectors by providing visual metaphors for complex ideas.
- Business Workflow and Operations: Manufacturing, logistics, and project management rely heavily on sequential thinking. Isometric 3D templates are ideal for mapping out supply chains or software development lifecycles. The ability to show connections between "steps" using pipes, conveyor belts, or connecting lines in 3D space helps clarify dependencies that linear lists often obscure.
- Marketing and Advertising: In graph advertising and social media campaigns, stopping the scroll is the first hurdle. Bright, dimensional illustration styles stand out against white backgrounds. Marketers use these templates to highlight product features, compare service tiers, or visualize customer funnels. The tactile nature of 3D graphics makes intangible services feel more concrete to potential buyers.
- Education and Training: Educators and corporate trainers use these designs to break down dense information. Whether explaining biological systems, mechanical engineering concepts, or organizational structures, 3D diagrams help learners visualize spatial relationships. A milestone timeline featuring ascending platforms, for example, creates a clearer mental model of progress than a horizontal line.
- Finance and Reporting: Financial data can be dry. Using 3D chart elements to represent revenue streams, expense categories, or investment portfolios adds a layer of visual interest without sacrificing clarity. Stacked coins, rising pillars, and volumetric pie charts make numerical content data more digestible for non-expert audiences.
Choosing the Right Style for Your Message
Not all 3D templates serve the same purpose. Before downloading or purchasing an Infographic Template with 3D Shape, consider the tone and technical requirements of your project. The term "3D" covers a wide spectrum of visual styles, and selecting the wrong one can create dissonance in your design.
Isometric vs. Perspective: Isometric designs use a fixed 30-degree angle with no vanishing points. This style is clean, technical, and excellent for architectural layouts, server rooms, or precise workflow layout diagrams. True perspective 3D, conversely, uses vanishing points to create dramatic depth. This is better suited for hero banners, creative backgrounds, or marketing materials where emotional impact matters more than technical precision.
Material and Texture: Modern templates often feature clay-like, matte finishes or glossy, glass-morphism effects. Matte, pastel-colored shapes tend to feel friendly, approachable, and modern, making them suitable for startups, educational content, and lifestyle brands. High-gloss, metallic, or neon textures convey technology, finance, and futurism. Aligning the material aesthetic with your brand identity ensures the graphic supports your message rather than distracting from it.
Editability and Format: Always verify the file format before committing. True vector files (AI, EPS, SVG) allow you to resize elements infinitely and change colors to match your brand palette without quality loss. Rasterized 3D renders (PNG, JPG) may look sharper initially but limit your ability to customize. If you need to adapt a template for different contexts—such as resizing a banner for LinkedIn versus Instagram—vector flexibility is essential.
Best Practices for Implementation
Having access to high-quality assets does not guarantee a successful design. Overusing 3D elements is a common pitfall. Because these shapes carry significant visual weight, they compete for attention. To maintain readability and professional polish, treat 3D shapes as structural anchors rather than background noise.
Use negative space strategically. Allow your info graph elements to breathe. Crowding dimensional objects together creates visual clutter and confusing shadows. Ensure that text labels remain legible against complex backgrounds; sometimes placing text on a semi-transparent overlay or keeping it outside the 3D composition is necessary for accessibility.
Consistency is equally critical. Do not mix different lighting sources or artistic styles within a single diagram. If your primary icon set uses soft top-left lighting, introducing a harshly lit, glossy element from a different pack will break the immersion. Stick to a cohesive library or adjust individual elements to ensure uniform shading and color temperature throughout your layout.
Finally, remember that the goal is communication, not just decoration. Every 3D element should serve a functional role in guiding the viewer’s eye or clarifying a relationship. If a flat circle communicates a data point just as effectively as a rendered sphere, choose simplicity. Reserve the Infographic Template with 3D Shape for moments where depth genuinely enhances understanding or emphasizes a key idea. By balancing aesthetic appeal with functional clarity, you create visuals that are not only beautiful but also effective tools for conveying complex information in an increasingly competitive visual environment.