Solar Energy Equipment Infographic: Integrating Visual Assets into Professional Workflows
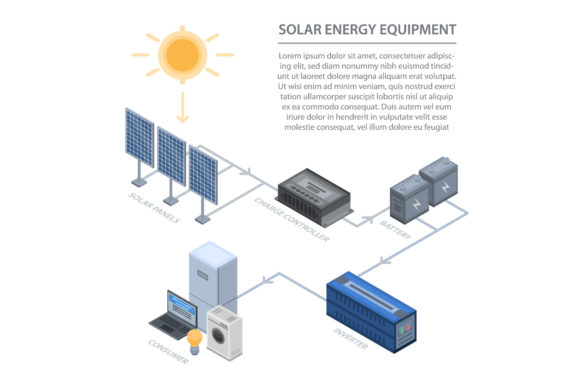
In the renewable energy sector, technical accuracy and visual clarity are often at odds. Engineers possess detailed schematics, while marketers need engaging social media content. The solar energy equipment infographic serves as the critical bridge between these two domains. Specifically, an isometric vector infographic for web design is not merely a decorative element; it is a functional communication tool that translates complex photovoltaic systems into digestible visual data. For professionals ranging from solar installers to educational content creators, understanding how to source, edit, and deploy these assets is essential for maintaining workflow efficiency and brand consistency.
The Role of Isometric Vectors in Technical Communication
An isometric projection provides a three-dimensional representation of solar equipment without the distortion of perspective. This makes it uniquely suited for explaining spatial relationships in solar arrays, inverter setups, and battery storage systems. When utilizing a solar energy equipment infographic in this style, the primary advantage is scalability. Unlike raster images, vector formats maintain crisp edges at any resolution, making them ideal for everything from mobile web interfaces to large-format trade show banners.
For web designers and developers, these infographics function as modular components. Rather than designing a new illustration for every landing page, teams can utilize a comprehensive vector pack to build a consistent visual library. This reduces design debt and ensures that the depiction of solar panels, mounting hardware, and electrical components remains uniform across all digital touchpoints. The isometric view specifically aids users in understanding installation angles and roof integration, which are common friction points in customer education.
Selecting the Right File Format for Your Workflow
Professional asset packs typically include multiple formats, including JPG, EPS, AI, PSD, and PNG. Understanding when to use each format prevents bottlenecks during production. Choosing the correct file type depends entirely on the current stage of your project and the software ecosystem your team utilizes.
- AI (Adobe Illustrator): This is the master source file. Use AI files when you need to modify colors to match brand guidelines, adjust component proportions, or create custom configurations. It preserves layers and editable paths, making it indispensable for long-term asset management.
- EPS (Encapsulated PostScript): The universal vector standard. EPS files ensure compatibility across different vector editing platforms like CorelDRAW or Affinity Designer. If you are collaborating with external agencies or printers who may not use Adobe products, EPS is the safest delivery format.
- PSD (Photoshop Document): Essential for compositing. If your workflow involves placing solar equipment into photographic backgrounds or adding realistic lighting effects, the layered PSD allows for non-destructive editing within a raster environment.
- PNG: The web-ready standard with transparency support. Export to PNG only after finalizing edits. This format is optimized for web design, presentations, and documents where further vector manipulation is unnecessary.
- JPG: Best reserved for quick previews, mood boards, or low-bandwidth environments. Avoid using JPGs for final technical diagrams due to compression artifacts that can blur fine lines and text labels.
Pre-Project Planning and Asset Preparation
Integrating a solar energy equipment infographic effectively begins before the design phase. During the planning stage of a marketing campaign or educational module, audit the available vector assets against your technical requirements. A generic solar panel icon may suffice for a blog post about renewable trends, but a product specification page requires accurate depictions of specific inverter models or racking systems.
Create a standardized color palette map before opening the AI or EPS files. Solar industry branding often relies on specific shades of blue, green, and yellow. By defining these hex codes upfront, you can batch-replace colors in the vector file using global swatches. This preparation step eliminates the tedious process of manually recoloring individual elements later. Additionally, verify that the infographic includes isolated layers for key components. Being able to toggle visibility for batteries, inverters, or monitoring systems allows you to create multiple variations from a single master file, significantly increasing the asset's ROI.
Implementation During Creative and Technical Execution
During the active creation phase, the solar energy equipment infographic acts as a dynamic template. For web designers building responsive layouts, SVG exports derived from these vectors provide lightweight, scalable graphics that improve page load speeds compared to heavy raster images. When implementing these visuals, consider the information hierarchy. Isometric views can sometimes appear cluttered if too many technical details are included. Strip away non-essential elements to focus on the core message, whether that is system efficiency, ease of installation, or aesthetic integration.
For educators and trainers, these infographics serve as interactive teaching aids. Because the files are vector-based, instructors can zoom in indefinitely during live presentations to highlight specific connections or safety features without losing quality. In e-learning development, individual components can be exported separately to create drag-and-drop interactions or animated assembly sequences. This practical application transforms static diagrams into active learning tools, improving retention rates for technical trainees.
Content marketers can leverage these assets to accelerate production cycles. Instead of commissioning custom illustrations for every article, use the infographic pack to create featured images, diagrammatic headers, and social media carousels. The isometric style is particularly effective for LinkedIn and Instagram, where clean, geometric visuals tend to perform well. By maintaining a library of pre-edited PNG exports categorized by topic (e.g., "Residential," "Commercial," "Off-Grid"), teams can populate content calendars rapidly without sacrificing visual quality.
Post-Production Optimization and Quality Control
After deploying a solar energy equipment infographic, quality control ensures the asset performs as intended across devices. Test vector renders on various screen sizes to confirm that stroke widths remain visible and text labels remain legible. On high-DPI mobile screens, thin lines in isometric drawings can sometimes disappear or alias poorly. Adjusting stroke settings in the source AI file and re-exporting may be necessary to guarantee accessibility and readability.
File organization is equally critical for long-term usability. Establish a naming convention that reflects both the content and the format, such as solar-inverter-isometric-v2.ai or residential-array-web.png. Store master vector files in a centralized digital asset management system rather than local desktops. This ensures that when team members need to update an infographic due to new technology or revised regulations, they are always working from the most current version. Version control prevents the circulation of outdated technical diagrams, which can damage credibility and lead to compliance issues.
Integration with Broader Business Systems
A solar energy equipment infographic does not exist in isolation; it interacts with CRM platforms, proposal software, and learning management systems. For sales teams, integrating customized infographics into proposals helps clients visualize their specific investment. Using editable vector files, sales engineers can quickly adjust array sizes or add battery backups to match a quote, providing a personalized visual experience that generic stock photos cannot offer.
Furthermore, consider the SEO implications of using these assets. Search engines cannot "see" images, but they index metadata. When uploading these infographics to your website, utilize descriptive alt text that references specific equipment and concepts depicted in the isometric view. Semantic keywords related to solar installation processes, system components, and energy efficiency should be naturally woven into image captions and surrounding content. This practice aligns visual assets with broader search intent, driving organic traffic from users seeking technical explanations or visual guides.
Maintaining Consistency Across Teams
One of the greatest challenges in multi-team environments is visual fragmentation. Marketing might use one style of solar illustration while engineering uses another. Adopting a standardized solar energy equipment infographic pack creates a unified visual language. Document usage guidelines that specify which file formats to use for which purposes, acceptable color modifications, and minimum clear space around isometric elements. This style guide ensures that whether a freelancer, an agency partner, or an internal employee creates content, the output remains cohesive.
Regularly review and update your vector assets to reflect industry advancements. Solar technology evolves rapidly, with new panel efficiencies and inverter form factors emerging frequently. Schedule quarterly audits of your infographic library to retire obsolete equipment depictions and integrate new technologies. Treating these visual assets as living documents rather than static decorations ensures they continue to serve as accurate, valuable resources for your audience.
Ultimately, the value of a high-quality solar energy equipment infographic lies in its versatility. By mastering the technical aspects of file formats, establishing efficient editing workflows, and integrating these visuals strategically across business functions, professionals can transform simple vector art into a powerful engine for communication, education, and conversion. The initial investment in acquiring and organizing premium isometric assets pays dividends through reduced production time, enhanced brand authority, and clearer technical storytelling.